
A simple infographic showing which countries import the most wool from Lesotho 🧶
📊 Made with #RStats
🇱🇸 Colours inspired by the Lesotho flag
📸 Icons added with {ggimage}
Code: https://github.com/nrennie/tidytuesday/tree/main/2026/2026-08-04#DataViz #ggplot2 #TidyTuesday
#ggplot2
3 posts · Last used 1d
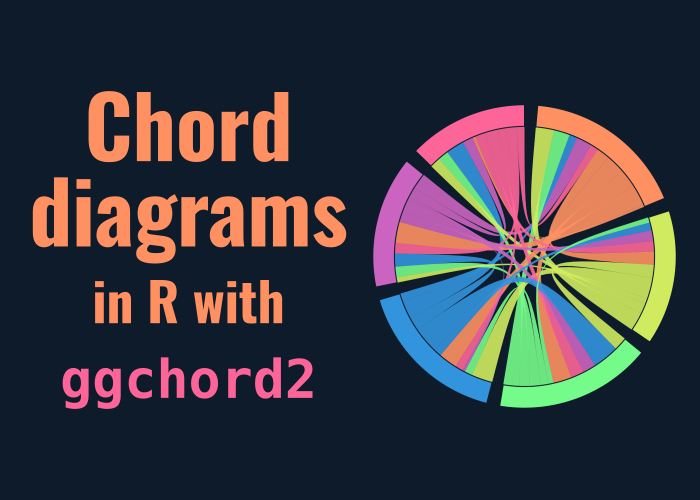
You can now make chord diagrams in #ggplot2 🎉
Here's a short blog introducing the 'ggchord2' package and showing you how to make chord diagrams 📊
Link: https://nrennie.rbind.io/blog/chord-diagrams-ggchord2/
#DataViz #RStats #RLadies
You've seen all posts